What is xG? A five-minute guide to expected goals
· 7 min read
The match is over and the scoreboard reads 1-0. But in the match you watched, one team may have circled the opponent's penalty area all match while the other team saw the goal only twice. The score and the real story of the game do not always tell the same thing. This is where xG, or expected goals, comes in: one of the most practical tools invented so you can see this difference.
In this article we explain, in plain language, what xG is, how it is read, where it can mislead you, and how it helps when watching or predicting a match. You don't need to know mathematics; it is enough to think about how "good a chance" a shot was.
The one-sentence definition of xG
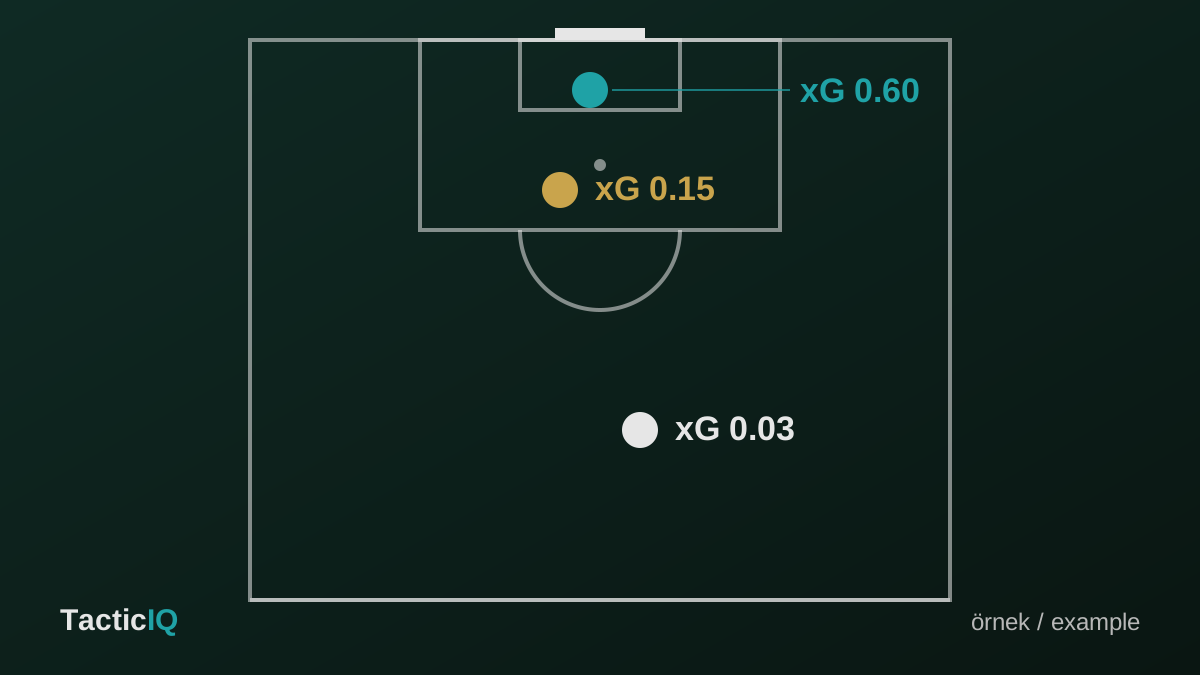
xG expresses the probability that a shot becomes a goal as a number between 0 and 1. A shot with a value of 0.05 becomes a goal on average five times in a hundred attempts. A shot with a value of 0.50 becomes a goal once in every two attempts. Values approaching 1 are almost certain goals: a ball into an empty net when the goalkeeper has fallen, or a shot from a few metres.
The key point is this: xG does not look at the name of the player who takes the shot, nor at his form on the day. It evaluates the position itself. In the same position, the world's best scorer and the league's most timid striker start with the same xG value. That is why xG measures "the quality of the chance created," not "player quality."
What determines a shot's xG value?
Models differ slightly from one provider to another, but all of them rest on analysing a large number of past shots. The value of a shot is usually determined by these factors:
- Distance: The closer you are to goal, the higher the probability.
- Angle: A shot from a tight angle close to the goal line receives a much lower value than one struck straight on.
- Type of strike: Differences such as a foot strike, a header or a volley are taken into account.
- How the chance arose: A set piece, a fast attack, a counter or a cross can be valued differently even from the same spot.
- In some models, the position of defenders and the goalkeeper: More detailed models take into account the number of defenders in front of the shooter.
All of them give one result: how often that shot has historically become a goal under these conditions. The values in the table below are examples meant only to give an idea; they are not the official output of any model:
| Example position | Example xG |
|---|---|
| From inside the six-yard box, one-on-one with the goalkeeper | 0.40 to 0.80 |
| Foot strike from the middle of the penalty area | 0.10 to 0.25 |
| Long-range shot from outside the penalty area | 0.02 to 0.05 |
| Strike from a very tight angle, close to the goal line | 0.01 to 0.03 |
How is xG collected over a match?
When the xG value of every shot is added up, the team's total xG for the match appears. For example, suppose a team takes fifteen shots, all slow strikes from outside the penalty area; its total xG might stay around 0.60. The opponent takes only three shots, but all three come from inside the penalty area in clear positions; its total xG could be 1.70.
If the score is 1-0 but the xG table says 0.60 against 1.70, then in this match the winning team was a little lucky and the losing team a little unlucky. A gap like this in a single match is very common; the real meaning is whether the same tendency continues over many matches.
The fallacy of "the team that shoots more plays better"
Classic statistics tables usually show the total number of shots. But shot count does not show the quality of an opportunity. If nine out of ten attempts are desperate strikes from impossible angles, you have simply "tried a lot." xG is therefore more meaningful than shot count: among the same number of shots, it separates which one was a real threat.
The reverse is also true: a team that takes few shots but creates very clear chances is superior. Teams playing on the counter, waiting for space to open, often take few shots but each one has a high value. Dismissing these teams just by looking at shot count is an easy mistake.
Where does xG mislead?
Like any measure, xG does not explain everything. Watch for these:
- A single match is noisy. Football is a low-scoring game; a single long-range strike or a single goalkeeper error can upset the xG table. A reliable tendency comes from the average of several matches, not from one match's xG.
- The score changes the game. A team that goes ahead early may retreat; a team behind may take risks and shoot more, but at lower quality. When reading the final xG, also think about the minute in which the score took shape.
- Models differ. The xG values of different providers for the same match do not fully match. When comparing, use the same source.
- Data is not available for every match. In some leagues and some matches, the data provider does not send the full set of team statistics. In that case the xG row may not appear at all. In TacticIQ, rather than showing a made-up number in such a case, the section is left empty.
- xG does not measure finishing. If a player scores more than expected over a season, he either has exceptional finishing or is having good luck. Separating the two requires a long time and a large sample.
How is xG used in everyday life?
Without getting buried in tables, you can develop a few simple habits:
- Match summary: Choose xG as the one second piece of data to look at alongside the score. It gives a quick answer to the question "did the score reflect the game?"
- Trend over the last few matches: If a team keeps producing more xG than its opponent over consecutive matches but cannot collect points, this may correct itself over time. The reverse also applies: a team that won by luck may lose that support after a while. Still, these are hints, not certainties.
- In-match reading: If xG rises during a live match, it shows that the team is looking for a goal and creating chances; even if the score has not changed, it tells you about the flow of the match.
- Questioning your own prediction: When predicting a score, asking "does this team really score this many goals?" and answering with the xG output of recent matches strengthens your instinct.
Where is xG in TacticIQ?
In TacticIQ, the Statistics tab on a match's details page shows the Expected Goals (xG) row alongside shots and possession, if the data provider sends it. Before the match starts this section looks empty; you see the note "Match statistics (shots, possession, xG…) will appear here once the match starts." If the provider does not send team statistics for a match, the app says so clearly and does not make up data.
In the prediction game, xG does not give you points directly; but it may be one of the most useful reasons you have when predicting the score, total goals and squad. A player who reads a match by how it developed, not only by its result, will predict more consistently over time.
A short reminder
xG is not a prophecy; it is a measure. It tells you how often similar shots in the past became goals; it does not guarantee whether today's shot will become a goal. The way to use it well is not to tie yourself to the number of a single match, and to treat the figure as a clue that completes the story of the game.
Next match, add one more question next to the score: "Was this score earned?" When you look for the answer, xG will be one of the first places you check.